Real optics under every sketch.
OpticSketcher is not a drawing program with arrows - it is an optics simulator. Every diagram is produced by a physical ray trace. Here are the models it implements, and where they come from.
Ray propagation
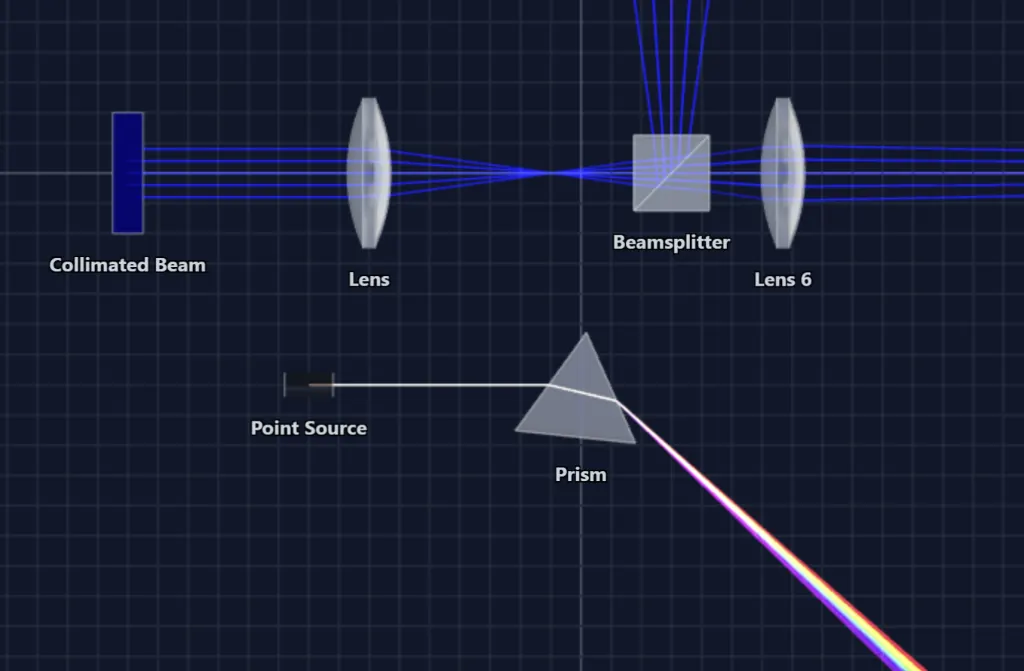
OpticSketcher is a 3D optical ray tracing simulator. Rays are launched from sources (single rays, collimated beams, diverging bundles) and propagated through exact geometric intersections with each optical surface. Rays branch at splitters and partial reflections, and every branch carries its own intensity budget so energy is conserved throughout the trace.
Reflection & refraction
Refraction at every dielectric interface follows the vector form of Snell's law, including total internal reflection when the critical angle is exceeded. Fresnel surface reflections can be enabled per element: reflectance uses the unpolarized Fresnel average ((Rs+Rp)/2) as a scalar intensity factor for the reflected and transmitted branches. This is not a polarization-resolved s/p split at the dielectric interface. With Fresnel reflections off, surfaces behave as ideally anti-reflection coated.
Material dispersion
Wavelength-dependent refractive indices are evaluated with Sellmeier equations using published coefficients for real catalog materials - N-BK7, UV fused silica, N-SF11, and CaF₂ (sourced from refractiveindex.info). White-light sources launch 11 spectral samples spaced equally in wavenumber (1/λ) between 400 nm and 700 nm, each carrying equal power, so a prism produces a discrete sampled spectrum rather than a continuous one. A direct-index mode with a linear dn/dλ coefficient is also available for quick custom glasses.
Polarization
Each ray carries a full Stokes vector, so unpolarized, partially polarized, and fully polarized light are tracked through the optical train. Optical elements act via Mueller matrices - polarizers, retarders, and rotators - and the polarization reference frame is parallel-transported along every ray path so the state stays geometrically consistent through folded, three-dimensional beam paths. Polarizing beamsplitters use a Jones-amplitude split for coherent, fully polarized light (preserving the polarization ellipse and phase) and fall back to a Mueller split for partially polarized light, with an enforced energy budget at every split. Dielectric Fresnel reflections still use the unpolarized intensity average described above, not a full Mueller/Jones Fresnel interface model.
Waveplates
Waveplates are modeled with the standard Mueller retarder matrix, parameterized by fast-axis orientation and retardance. Quarter-wave and half-wave behavior emerges naturally: convert linear to circular polarization, rotate a linear state, or build compound polarization optics and verify the output state on a sensor.
Faraday rotation
Faraday rotators implement magneto-optic rotation with real material data for TGG and KTF crystals. Verdet dispersion uses the approximate scaling V(λ) = V₆₃₃·(633/λ)² (a 1/λ² model anchored at 633 nm), not a full measured Verdet spectrum, and the refractive index follows a Cauchy dispersion fit. The simulator computes the magnetic field required for a chosen rotation angle from B = θ / (V·L) - the same relation used when specifying real optical isolators.
Birefringence
Birefringent crystals split light into ordinary and extraordinary rays. The extraordinary ray direction is computed from the uniaxial crystal walk-off relation using the ordinary and extraordinary indices and the optic-axis orientation, reproducing the beam displacement used in real polarizing optics.
Diffraction gratings
Diffraction gratings redirect light according to the grating equation, producing wavelength-dependent diffraction orders. Combined with dispersion, this lets you sketch spectrometer-style layouts and see how a grating separates a broadband beam into its spectral components.
Sensor analysis
Sensors record every ray that hits them: position on the detector face, wavelength, intensity (S₀), and full polarization state. A built-in analysis view plots the spatial hit profile, summarizes the statistics, and exports the raw per-ray data as CSV for further analysis outside the tool.
Scope and honest limits
OpticSketcher is a geometric (ray-optics) simulator built for sketching, understanding, and communicating optical setups. It traces rays, intensities, and polarization states with real physical models - it is not a substitute for full wave-optics or lens-design software when you need diffraction-limited PSFs, tolerancing, or optimization. For layouts, concepts, teaching, and design discussions, that trade-off is exactly the point: physics you can trust, at the speed of a sketch.
See these models in action in the Example Gallery .